- Charts
Features
Empower your trading with professional-grade analysis tools designed for clarity and performance.
Charting
Our charting module offers more than 45 indicators, all with customization, for stock and options trading on multiple timeframes. The charts also show stock and options positions and allow you to adjust trades directly.
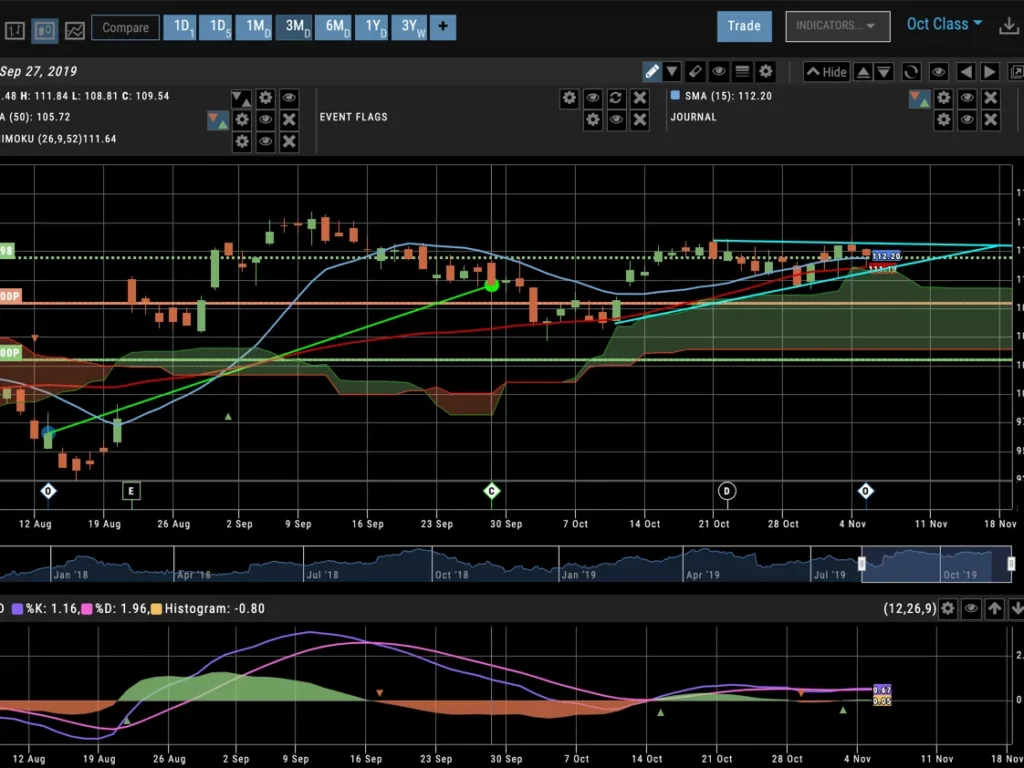
Everything Visual
Our charts show indicators and positions, but also prior trades, backtesting, and more when you need them to.
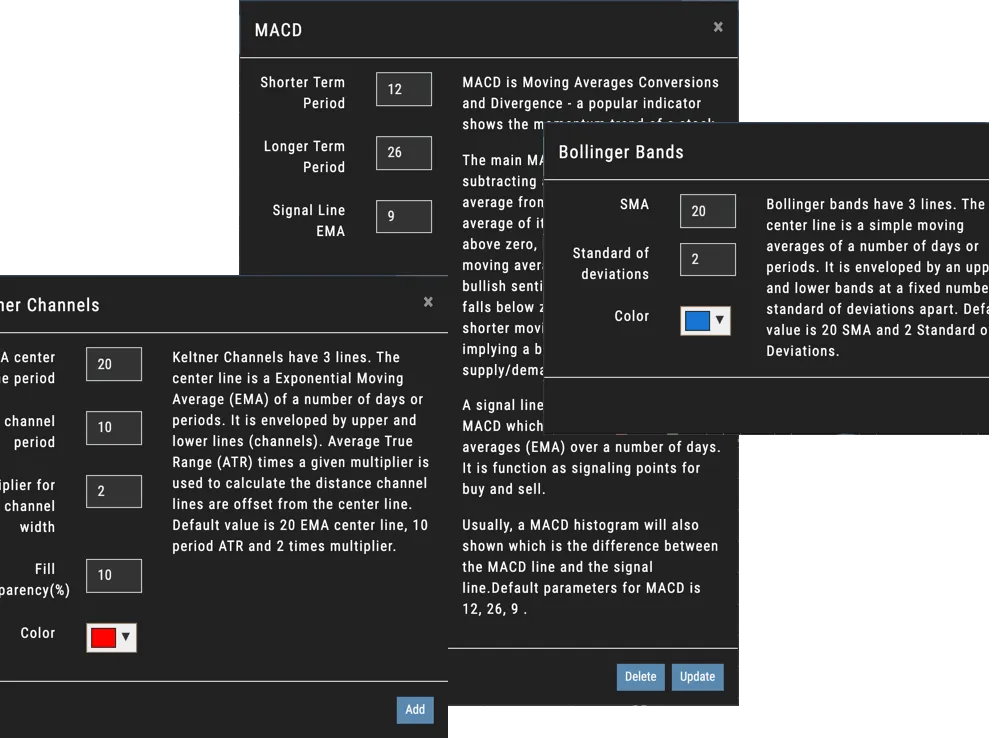
Indicators Your Way
We have over 45 indicators so you can pick the tools you care about and then customize them to match your exact needs.
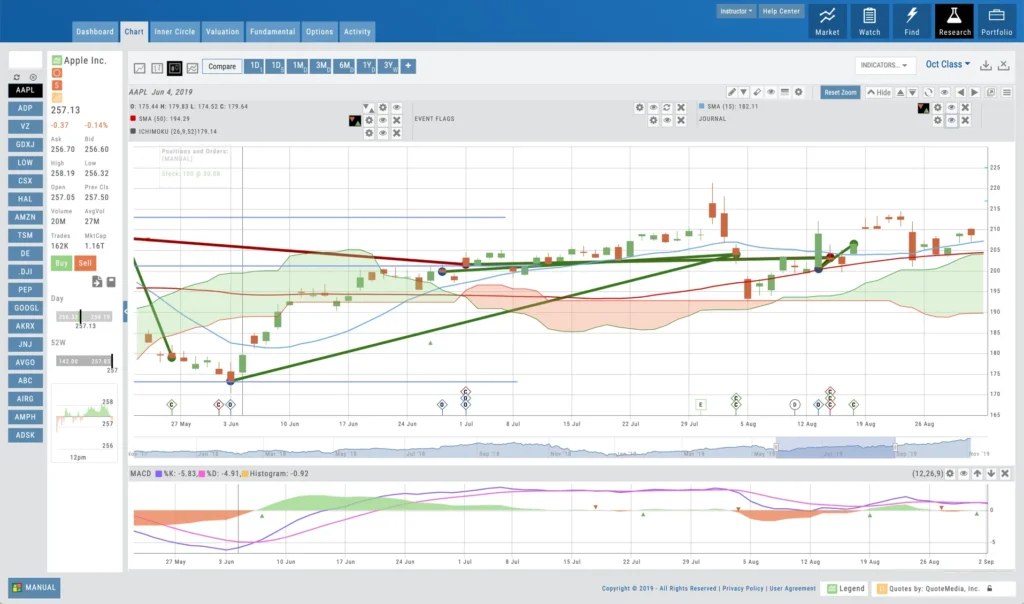
Past, Present, and Future Trades
Our charts show indicators and positions, but also prior trades, backtesting, and more when you need them to.
Customize
Trade
Journal
Indicators
Finding Trades
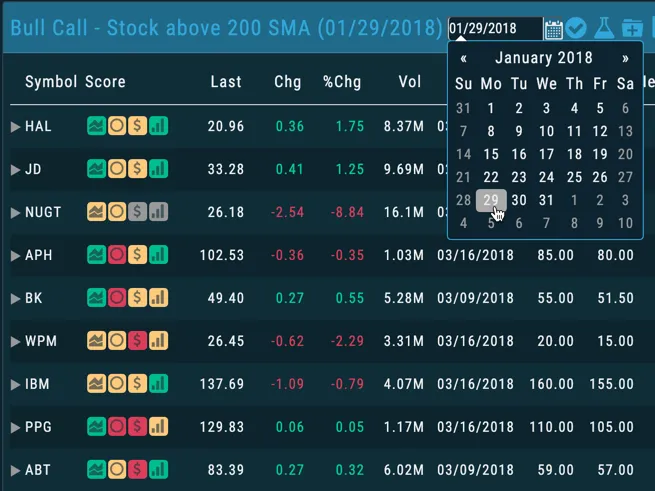
The Charts has several ways to find market opportunities. Everything from institutional trade activity, to custom screeners, to our exclusive Trade Finder Scans.
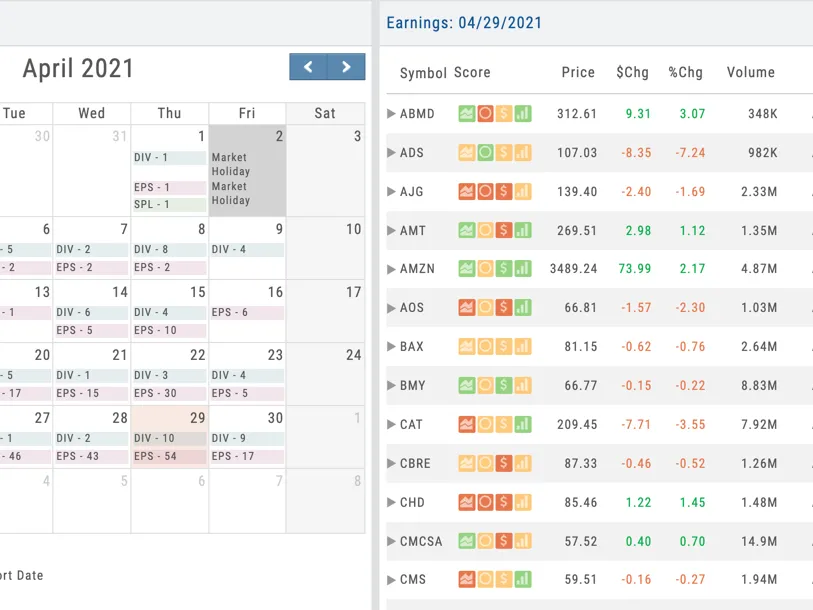
Event Based Opportunities
Calendars
Dividends and Splits can be a great way to trade. We show you upcoming events, and we track how past events played out. See if a company missed or beat its earnings. Find upcoming splits and dividend dates too. All in one easy-to-use calendar.
Find Stocks Your Way
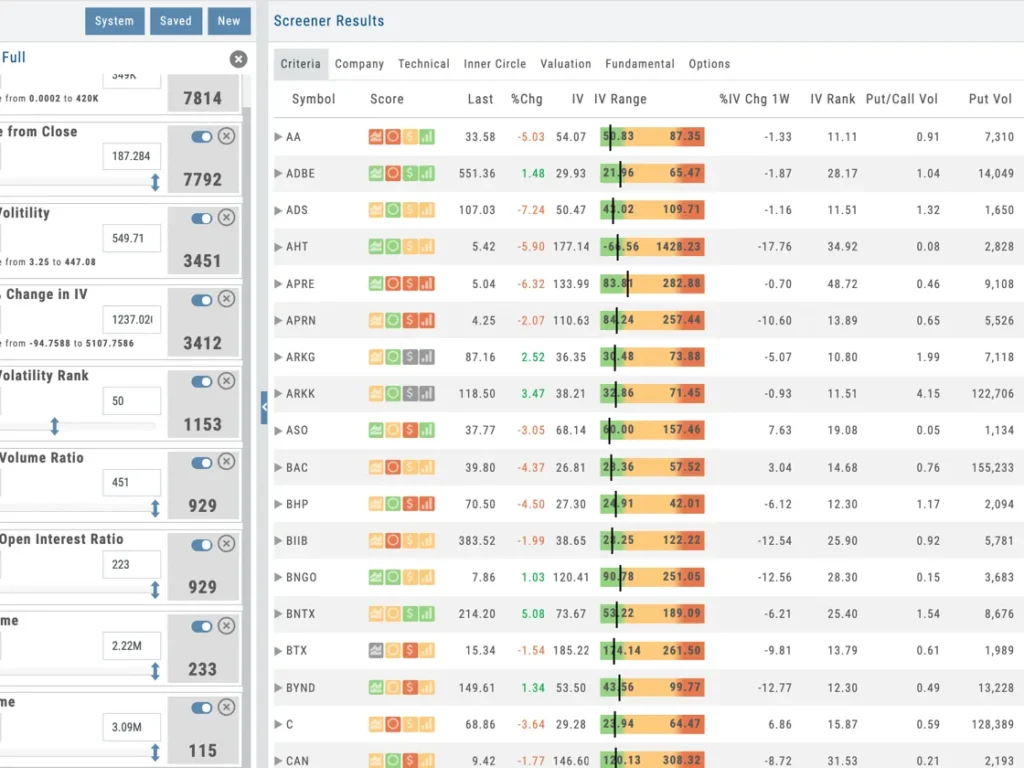
Custom Screener
Most traders need actionable trading ideas to put their money to work. Our Advanced Stock Screener has hundreds of data points that can be used to find the right stock and options plays based on your desired criteria. With broad spectrum data point covering chart activity, changes in institutional holding, company-key performance-indicators, earnings quality, and even options activity you can sort through 12,000 stocks to find exactly what you want.
Trade Ideas Made Fast & Easy
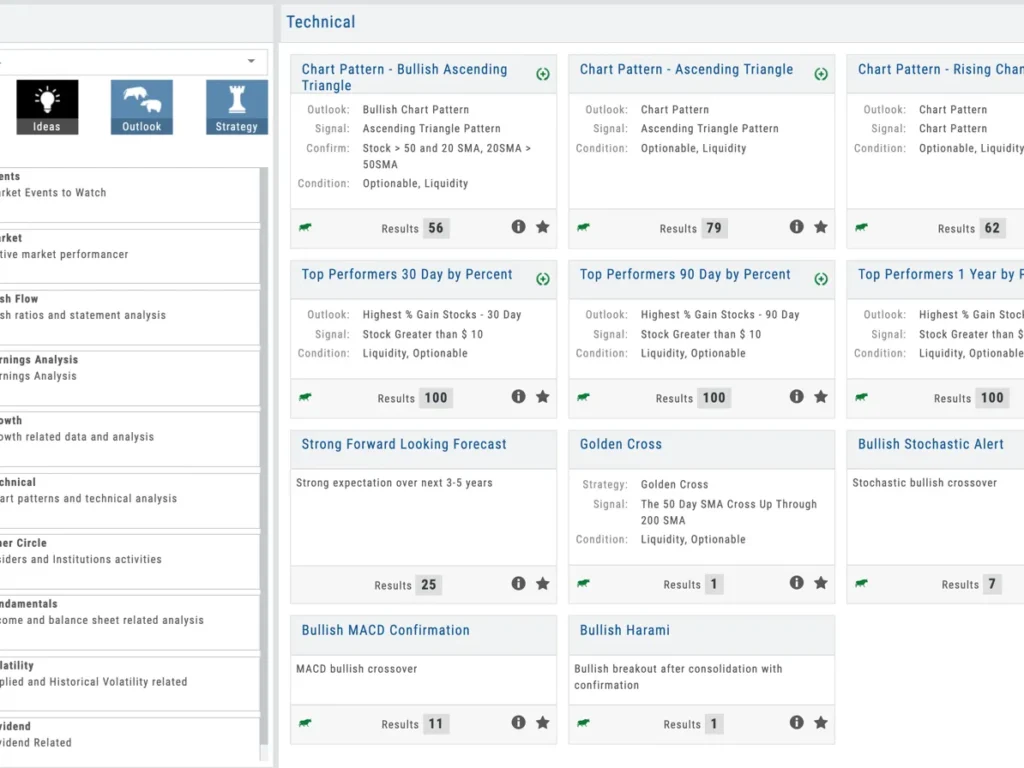
Idea Generators
Charts uses multiple data sources and intelligent calculations to find diverse ideas for the market. You can now find companies with algorithms based on fundamental data, institutional interest, earnings potential and chart patterns – all within one scan. Data is divided into categories to make it easy to find ideas to fit any market condition or outlook.
Options Trades Made Easy
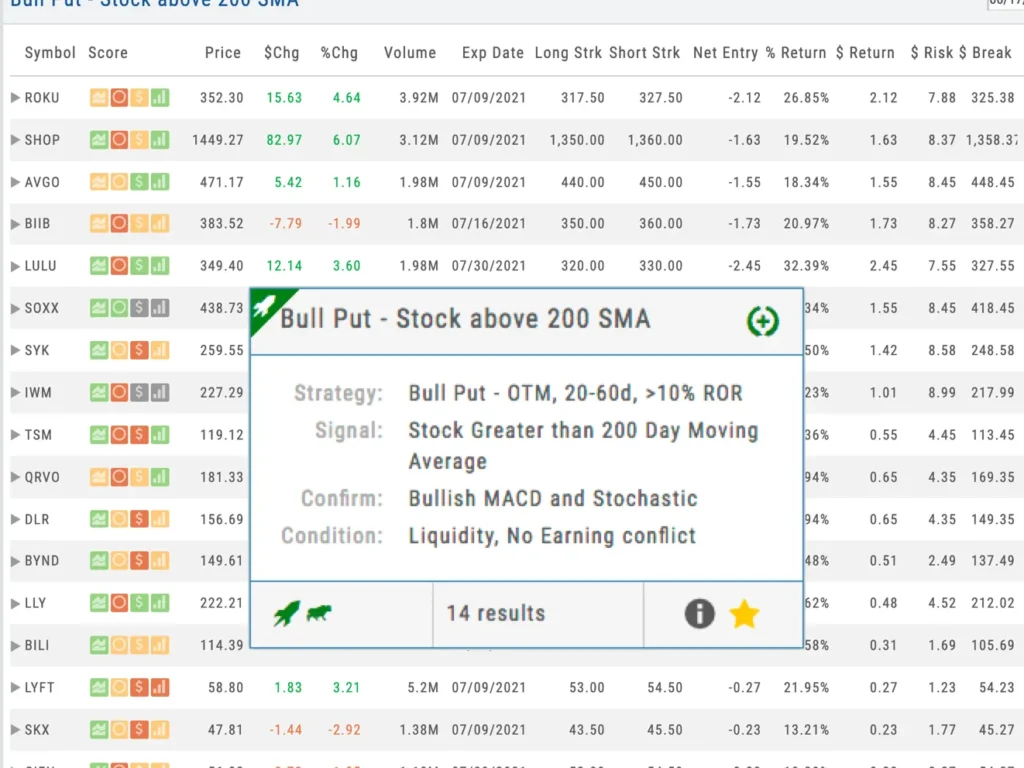
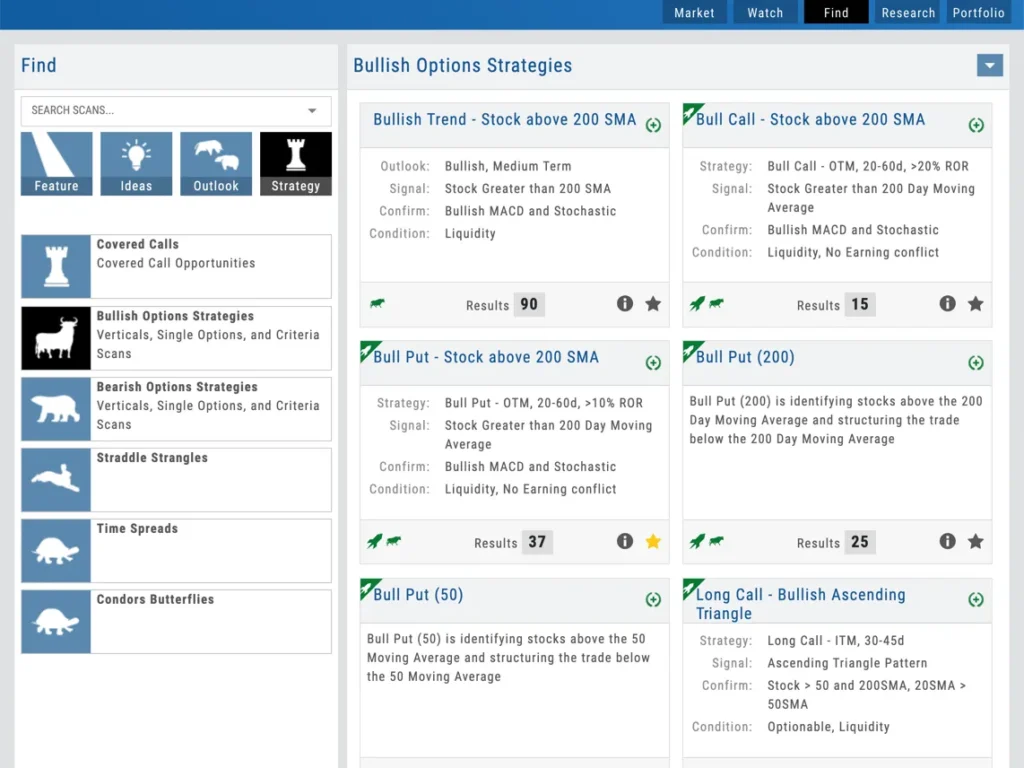
Options Trade Finder Scans
Take the idea to the next level with advanced strategy screeners. Is the market positioned for straddle or condor before Earnings? What about high-interest call-out candidates? Strategy screeners help guide your trades by providing data-driven insights. This is the fastest way to find an options trade.
Alerts
Our Alerts System will alert you of stock movement you want to know about. Not only price and volume, but also moving average crossovers, new highs and new lows, even advanced indicators like Bollinger Bands and Keltner Channels.
Never Miss the Action
From Pop-up notifications to In-Watch List marking to the alert control panel, you will easily see the Alert Triggers in Charts.
Push Alerts to Mobile
Coming Soon: Real-Time Alerts will send to your mobile devices. With just a tap, the App is open and you’re ready to trade. With the App you’re just a tap away from the action.
Easy to Add - Manage
Alerts can be added from Watch List, Action Menu, Research Page, and many more. Anywhere you see the Alert bell, you can add, edit, delete, and manage your Alerts. Making it easy to let the Platform keep an eye out for you.
Research
The research module starts with a heat map and allows you to drill down to earnings, financials, and the insider score quickly. Everything is cross-tabulated so you can sort by the research or by the stock and industry. Speed is everything, and with our progressive web-app approach, it makes the browser perform faster than traditional websites.
Finding Opportunity
Finding the right opportunity is the key. The platform offers advanced screeners by combining various points of market data, which users can use to scan the market or do fundamental research before placing a trade. Charts can offer pre-built or customized trade finder scans.

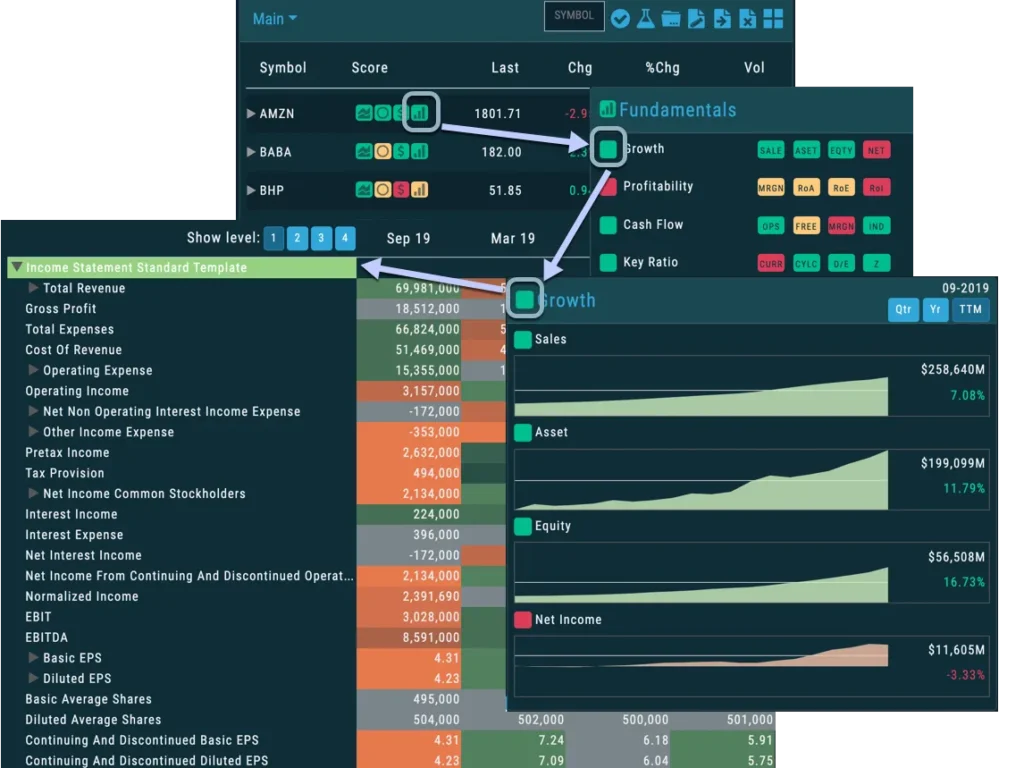
Fast, Easy, Highly Visual
Designed with simplicity and speed in mind, we deliver information only when you need it. Start with a visual overview of our scanners and then drill down to the level of detail you want.
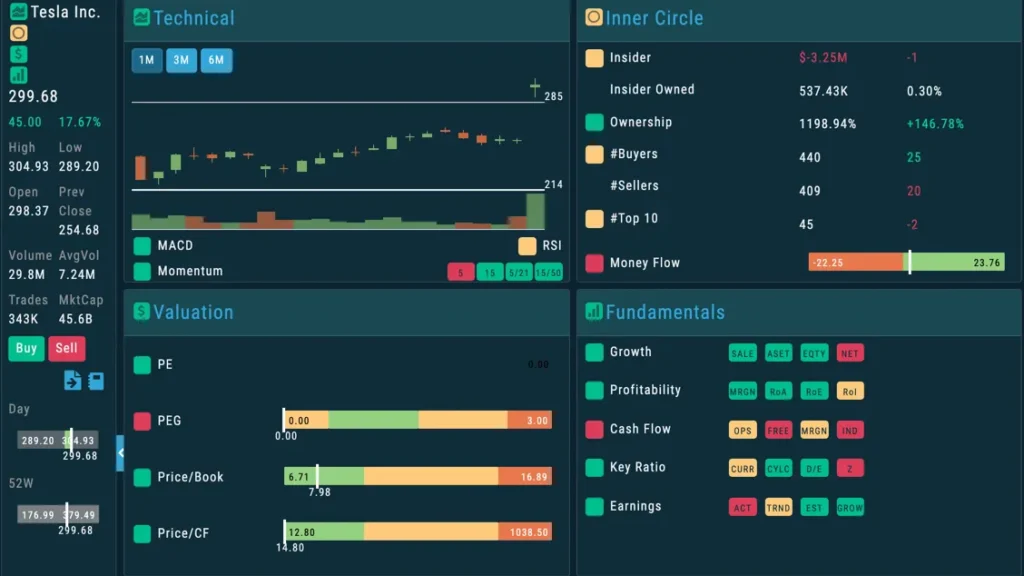
Intelligent Research
Using our dashboards, you can learn more about the company you want to trade than ever. Visualize earnings in a well-rounded set of charts, Insider Score and institutional trading, valuations, and fundamentals. It’s all here – organized intelligently.
INSIDER STRATEGIES
Our research tools show historical and projected forward earnings numbers for over 12,000 companies.
Valuations
Get an overall look at the company through key ratios and valuations, including tables and comparison charts.
Money Flows
View how money goes in and out of various companies through deep balance sheets, cash versus income statements, and more.
Insiders and Institutions
See what funds are investing in a stock, which are selling it, and how insiders are trading their own shares.
Options
The Options module is built to keep traders focused on the strategy that they are using. With over 20 options strategies to choose from, Charts allows you to move your strike prices vertically with simple clicks that expose the risk charts for the trade. You can also make custom multi-leg strategies of your own.
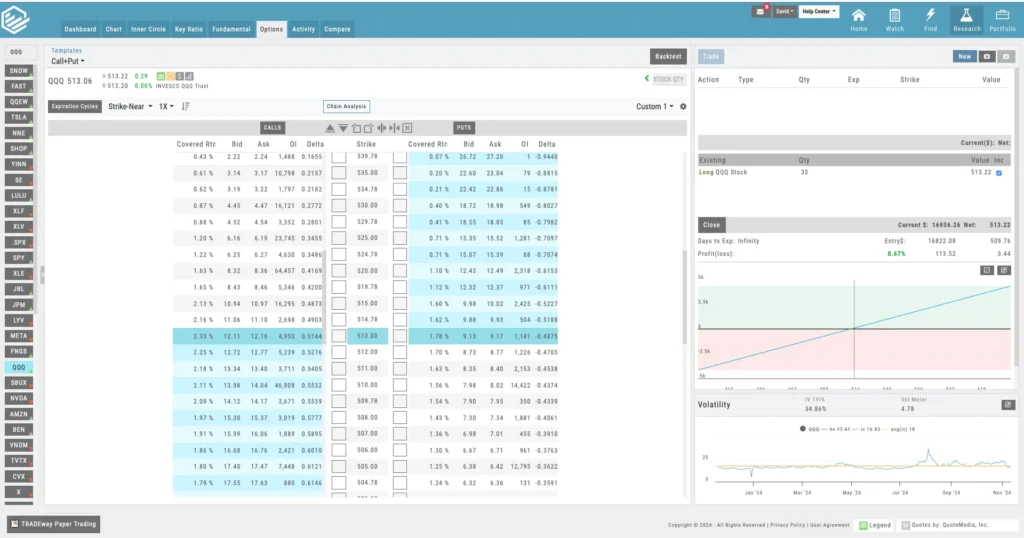
Everything is Clickable
Trade from the Chain
With our options analytics, you can trade straight from the options strategy templates or use the options chain to further customize your strategy to match your risk profile.
Every Strategy Ready to Go
More Than 20 Options Strategy Templates
Most traders need actionable trading ideas to put their money to work. Our Advanced Stock Screener has hundreds of data points that can be used to find the right stock and options plays based on your desired criteria. With broad spectrum data point covering chart activity, changes in institutional holding, company-key performance-indicators, earnings quality, and even options activity you can sort through 12,000 stocks to find exactly what you want.
An Options Tool for Everyone
Whether you just want to buy a call or put and see it on your chart or you want to dig into deep, complex options strategy, the options module keeps you focused on what you are looking for while offering levels of information.
Definitions
Hashtags allow you to sort your trades by type and analyze the results so you can see which trade setups are the most profitable over time.
Ease of Use
We built our user interface with simplicity in mind. You can vertically adjust strike prices with a single click or change expiration months on the fly.
Stay Locked in a Strategy
If you are looking at a specific strategy, Charts doesn’t allow you to stray outside of the legs of that strategy when using the templates so you don’t accidentally structure a different strategy.
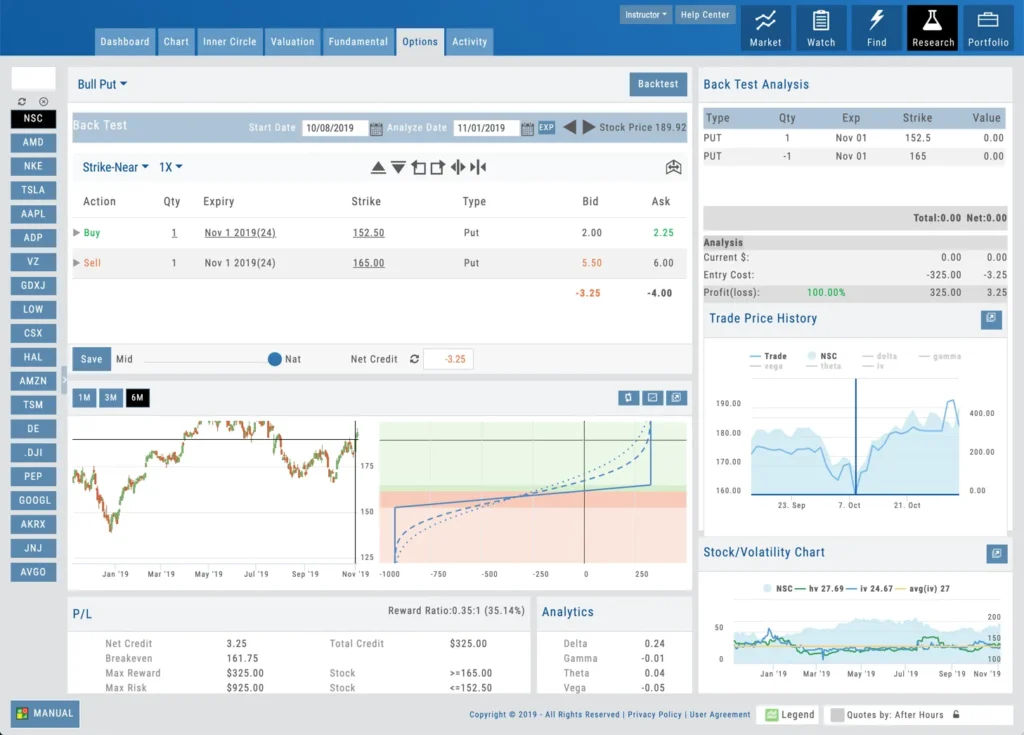
Backtesting
Unlike most platforms, you can easily backtest a system or trade going back years using end-of-day pricing data. See everything on a chart as it would have played out.
Backtesting
Our backtesting module shows you a day by day view of how your trade would have played out. In addition, you can compare up to three trades to see what would have worked better. We offer 15 years of stock and options data for backtesting.
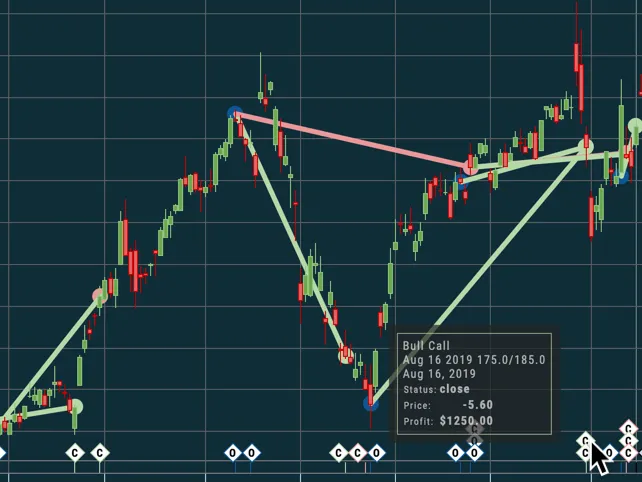
Visual Backtesting
Put It On The Chart
The Platform was designed with backtesting in mind. You can run backtests and display them on charts so you can see where and how they would have played out and visually view the entries and exits.
Scan Lookback
Get Confident
Build a quicker understanding of the various strategies and learn how they would work over time. Our scans are designed to make you profitable, but our backtesting helps you see how.
Various Strategies
Backtesting Solutions for All Your Trading Needs
Charts was designed to help all traders find backtest various strategies. Whether you are looking at all trade types or honing in on a specific strategy, we give you the visual and statistical tools to know how various trades would have worked.
As Easy As 1, 2, 3
Backtesting is as easy as picking a start date, a strategy, and an analyze date to see how the trade would be working.
Post Trade Analysis
Even after you complete a trade, you can backtest it to see how it performed day by day and learn how you could have done better.
Risk Analysis
Backtesting includes all of the calculations in one place: risk/reward, breakeven, greeks, and even net Greeks.
Freeform Testing
Pick any combination of option legs and analyze how they would play out in a customizable trading strategy.
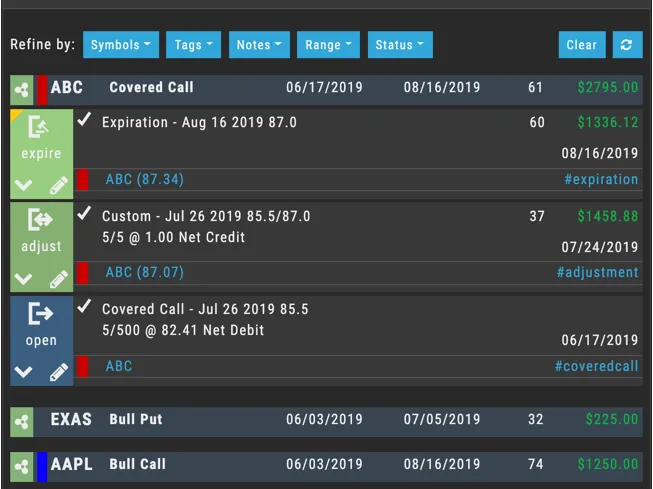
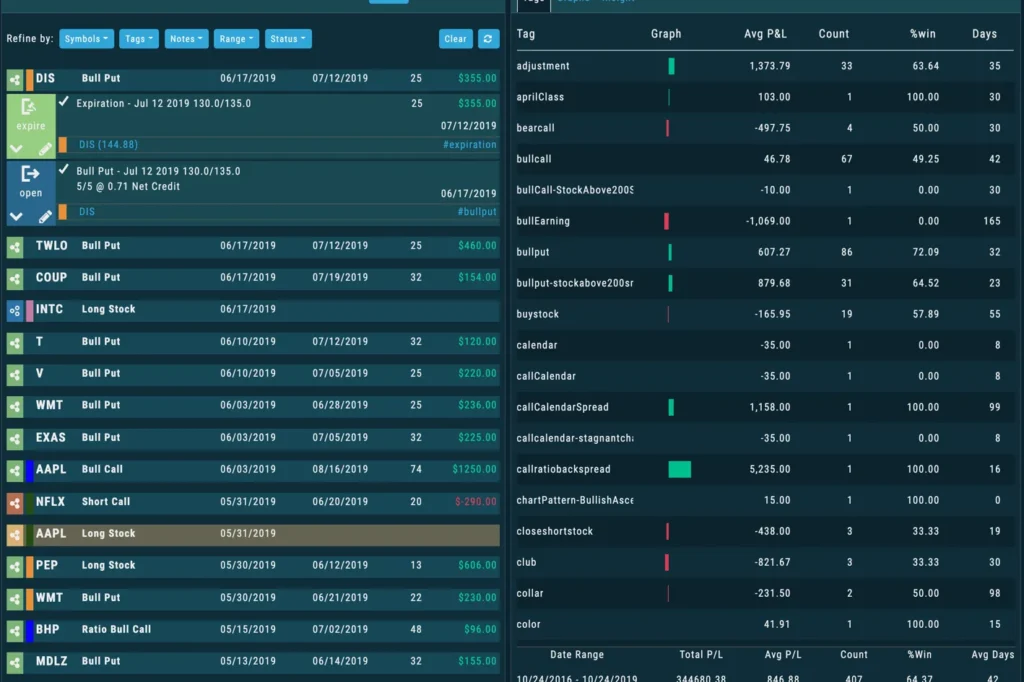
Journal
One of the most popular modules of the platform is the Trade Journal. All fixed trade types are tagged with hashtags such as #Ironcondor, #Bullput or #Bullcall – but traders can also add their own custom tags to every trade for easy sorting and reporting.
Success Lies in Results
Industry-Leading Trade Journal
Successful traders analyze their results to find patterns in what works and what doesn’t. Our Trade Journal module is one of the deepest in the industry for visually breaking down trades into clear reports.
Visual & Easy
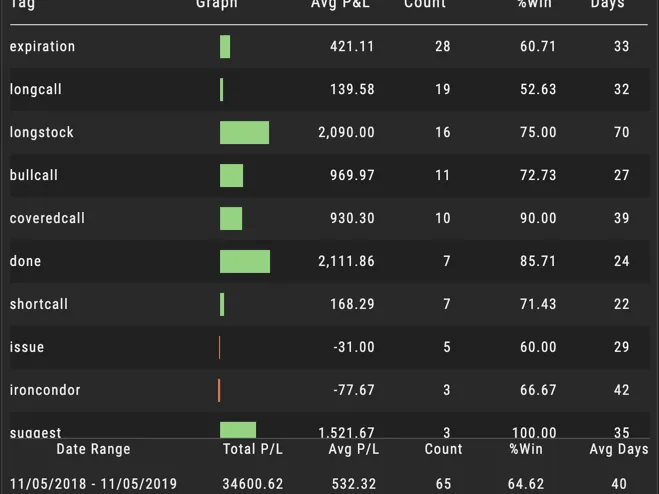
Trade Analytics
Our analytics and reporting lets you sort your trades and track results based on trade type or however you want to sort the results.
Powerful Reporting
Journaling Made Easy
Charts includes an industry-leading journal and reporting system that allows the user to tag all trades and sort them however they want. Professional reporting tools allow traders in various levels of statistical and visual detail where their strengths and weaknesses are.
Hashtags
Hashtags allow you to sort your trades by type and analyze the results so you can see which trade setups are the most profitable over time.
Auto-Journaling
Set any account to auto-journal the trades. The platform will do this automatically. But, you can also add your own hashtags and notes.
Journal Trades on Charts
View a group of trades in the journal, and then see a visual representation of the trades on a chart to show you when the trade was in play.
Reports and Analytics
Pick a hashtag and get a breakdown of all of the trades that have that tag. Sort by type and then drill down into specific results for that trade type.